|
|
||
|---|---|---|
| css | ||
| docs | ||
| js | ||
| .gitignore | ||
| LICENSE | ||
| README.md | ||
| ee-dashboard.png | ||
| favicon.ico | ||
| index.php | ||
| install.sh | ||
README.md
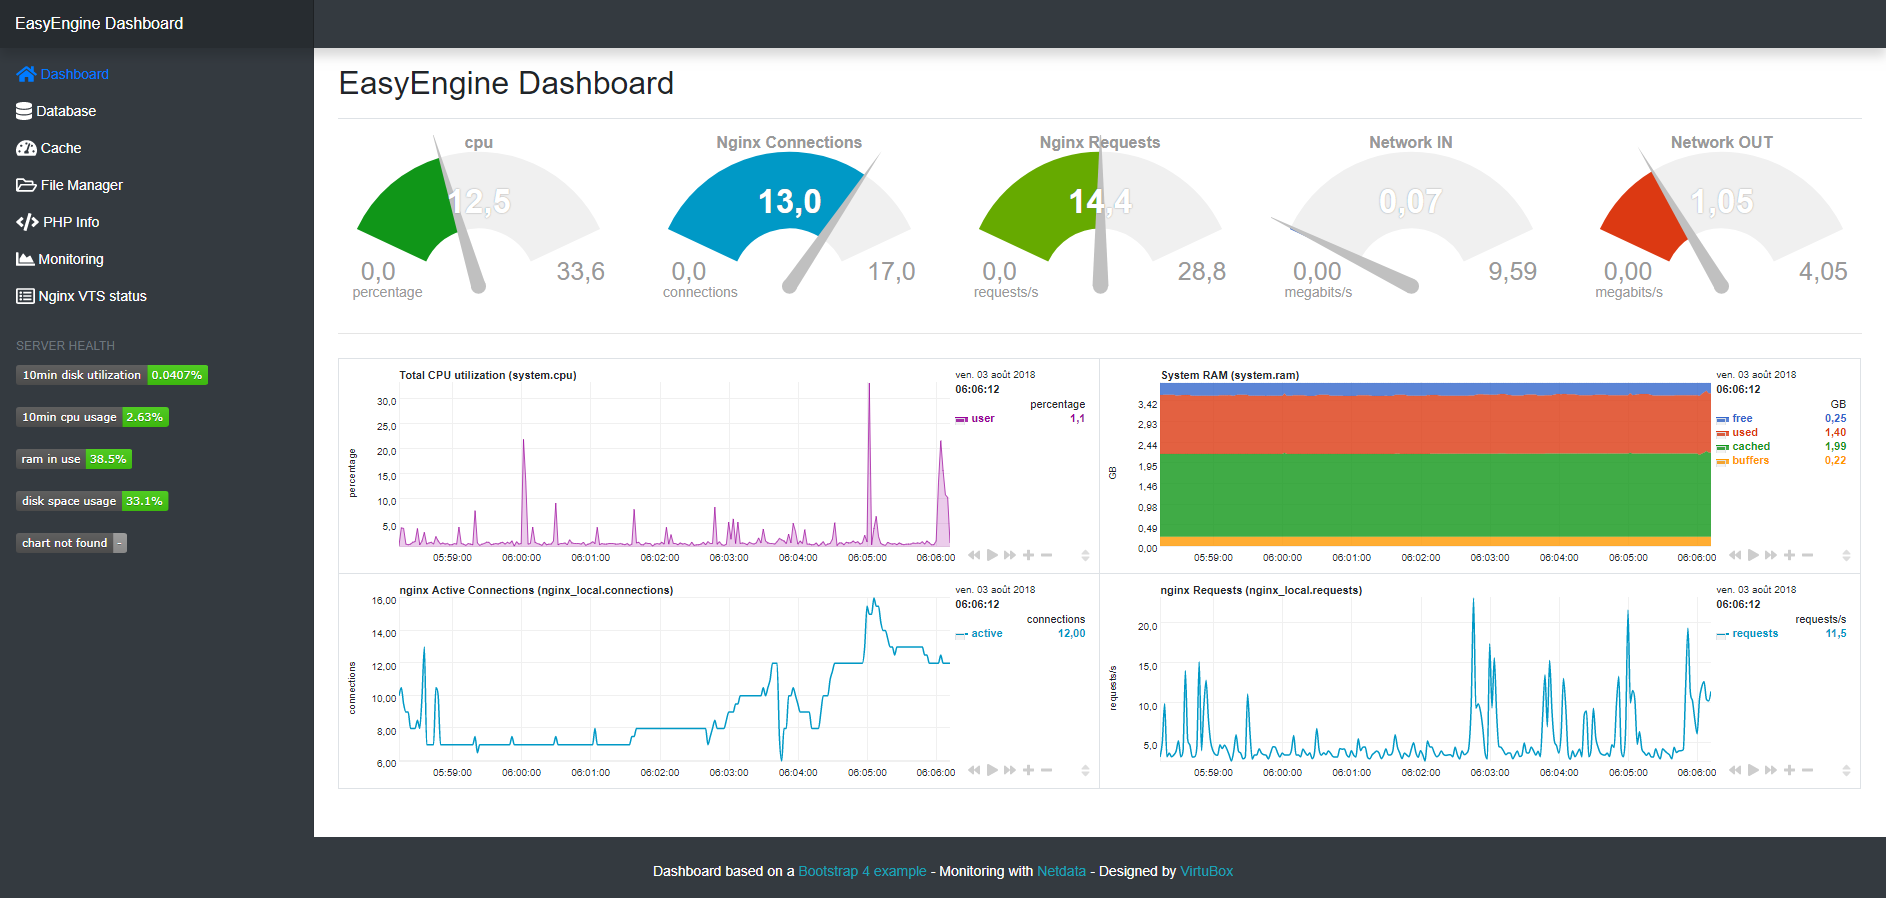
easyengine-dashboard
A clean bootstrap dashboard for EasyEngine
New version is available : WordOps-dashboard
Automated dashboard installation will be available soon in WordOps
Requirements
- EasyEngine
Installation
Automated install
bash <(wget -O - https://virtubox.github.io/easyengine-dashboard/install.sh)
Manual install
Install the Following Stacks
ee stack install --web --php7 --redis --admin --phpredisadmin
Update phpmyadmin (if needed)
cd ~/ || exit
curl -sS https://getcomposer.org/installer | php
mv composer.phar /usr/bin/composer
chown www-data:www-data /var/www
sudo -u www-data -H composer update -d /var/www/22222/htdocs/db/pma/
Install Netdata
## install dependencies
sudo apt-get install autoconf autoconf-archive autogen automake gcc libmnl-dev lm-sensors make nodejs pkg-config python python-mysqldb python-psycopg2 python-pymongo python-yaml uuid-dev zlib1g-dev -y

## install nedata
bash <(curl -Ss https://my-netdata.io/kickstart.sh) all --dont-wait

## optimize netdata resources usage
echo 1 >/sys/kernel/mm/ksm/run
echo 1000 >/sys/kernel/mm/ksm/sleep_millisecs

## disable email notifigrep -cions
sudo sed -i 's/SEND_EMAIL="YES"/SEND_EMAIL="NO"/' /etc/netdata/health_alarm_notify.conf
sudo service netdata restart
Nginx configurations
- added nginx & php-fpm status page to default vhost
- added netdata reverse-proxy configuration in 22222
- added php7.1, php7.2 and netdata upstream to upstream.conf
# add location for monitoring
wget -O /etc/nginx/sites-available/default  https://virtubox.github.io/ubuntu-nginx-web-server/files/etc/nginx/sites-available/default

# replace php5.6 by php7.0 and add netdata reverse-proxy
wget -O /etc/nginx/sites-available/22222 https://virtubox.github.io/ubuntu-nginx-web-server/files/etc/nginx/sites-available/22222

# php7.1 php7.2 & netdata upstream
wget -O /etc/nginx/conf.d/upstream.conf https://virtubox.github.io/ubuntu-nginx-web-server/files/etc/nginx/conf.d/upstream.conf
Install extplorer
mkdir /var/www/22222/htdocs/files
wget http://extplorer.net/attachments/download/74/eXtplorer_2.1.10.zip -O /var/www/22222/htdocs/files/ex.zip
cd /var/www/22222/htdocs/files && unzip ex.zip && rm ex.zip
Install easyengine-dashboard
wget https://github.com/VirtuBox/easyengine-dashboard/archive/master.zip -O easyengine-dashboard.zip
unzip easyengine-dashboard.zip && rm easyengine-dashboard.zip
sudo cp -rf easyengine-dashboard-master/* /var/www/22222/htdocs/
sudo chown -R www-data:www-data /var/www/22222/htdocs
Updating EasyEngine-Dashboard
Just perform again the last installation step
cd /var/www/22222 || exit
wget https://github.com/VirtuBox/easyengine-dashboard/archive/master.zip -O easyengine-dashboard.zip
unzip easyengine-dashboard.zip && rm easyengine-dashboard.zip
sudo cp -rf easyengine-dashboard-master/* /var/www/22222/htdocs/
sudo chown -R www-data:www-data /var/www/22222/htdocs
Troubleshooting
Network interfaces meter are not displayed on the dashboard
If you network interface isn't named eth0, you just have to use the command ifconfig to find its name and to replace eth0 with the proper interface name in the dashboard index.php file.
Example for a network interface named ens18 :
sed -i 's/eth0/ens18/' /var/www/22222/htdocs/index.php
Published & maintained by VirtuBox